Pyinterpolate#

version 1.2.1#
Note
The last documentation update: 2025-12-26
Important notice#
The package was updated to version 1.0 in June 2025. There are breaking API changes, so please, refer to the changelog, to know more about the changes.
Citation#
Moliński, S., (2022). Pyinterpolate: Spatial interpolation in Python for point measurements and aggregated datasets. Journal of Open Source Software, 7(70), 2869, https://doi.org/10.21105/joss.02869
Introduction#
Pyinterpolate is the Python library for spatial statistics. The package provides access to spatial statistics tools (variogram analysis, Kriging, Poisson Kriging, Indicator Kriging, Inverse Distance Weighting).
If you’re:
GIS expert
Geologist
Social scientist
Then this package may be useful for you. You could use it for:
spatial interpolation and spatial prediction
alone or with machine learning libraries
for point observations interpolation
and aggregated data disaggregation
You can run:
Ordinary Kriging and Simple Kriging - spatial interpolation from points
Centroid-based Poisson Kriging of polygons - spatial interpolation from blocks and regions
Area-to-area and Area-to-point Poisson Kriging of Polygons - spatial interpolation and data deconvolution from areas to points
Indicator Kriging - kriging based on probabilities
Universal Kriging - kriging with trend
Inverse Distance Weighting - benchmarking spatial interpolation technique
Semivariogram regularization and deconvolution - transforming variogram of areal data in regards to point support data
Semivariogram modeling and analysis - is your data spatially correlated? How do neighbors influence each other?
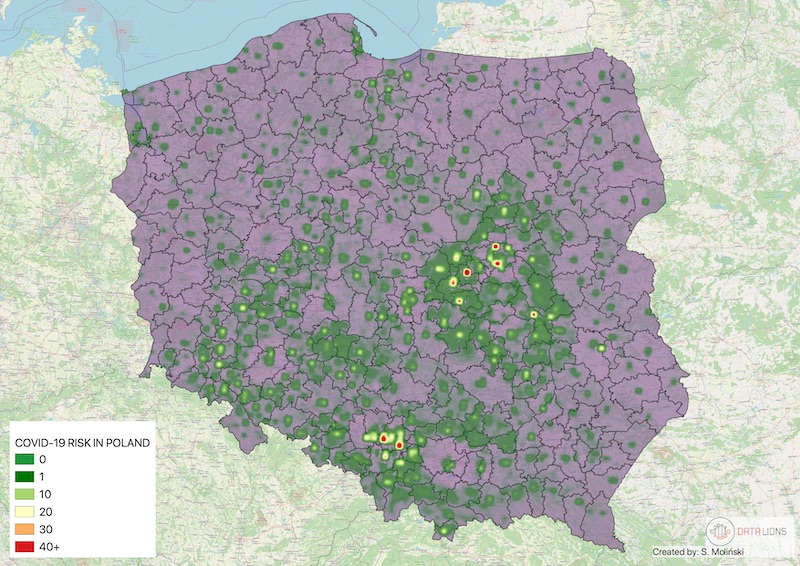
With Pyinterpolate you can transform data aggregated on a county-level to better resolution.
The example is COVID-19 population at risk mapping. Countries worldwide aggregate disease data to protect the privacy of infected people. But this kind of representation introduces bias to the decision-making process. To overcome this bias, you may use Poisson Kriging. Block aggregates of COVID-19 infection rate are transformed into the point support created from population density blocks. We get the population at risk map: